Columns
Columns is a fast and intuitive data visualization platform that helps teams turn raw data into clear, engaging stories. It supports a wide range of data sources including Google Sheets, Notion, Airta
8,162
Votes
11,629
Views
5,294
Bookmarks
About
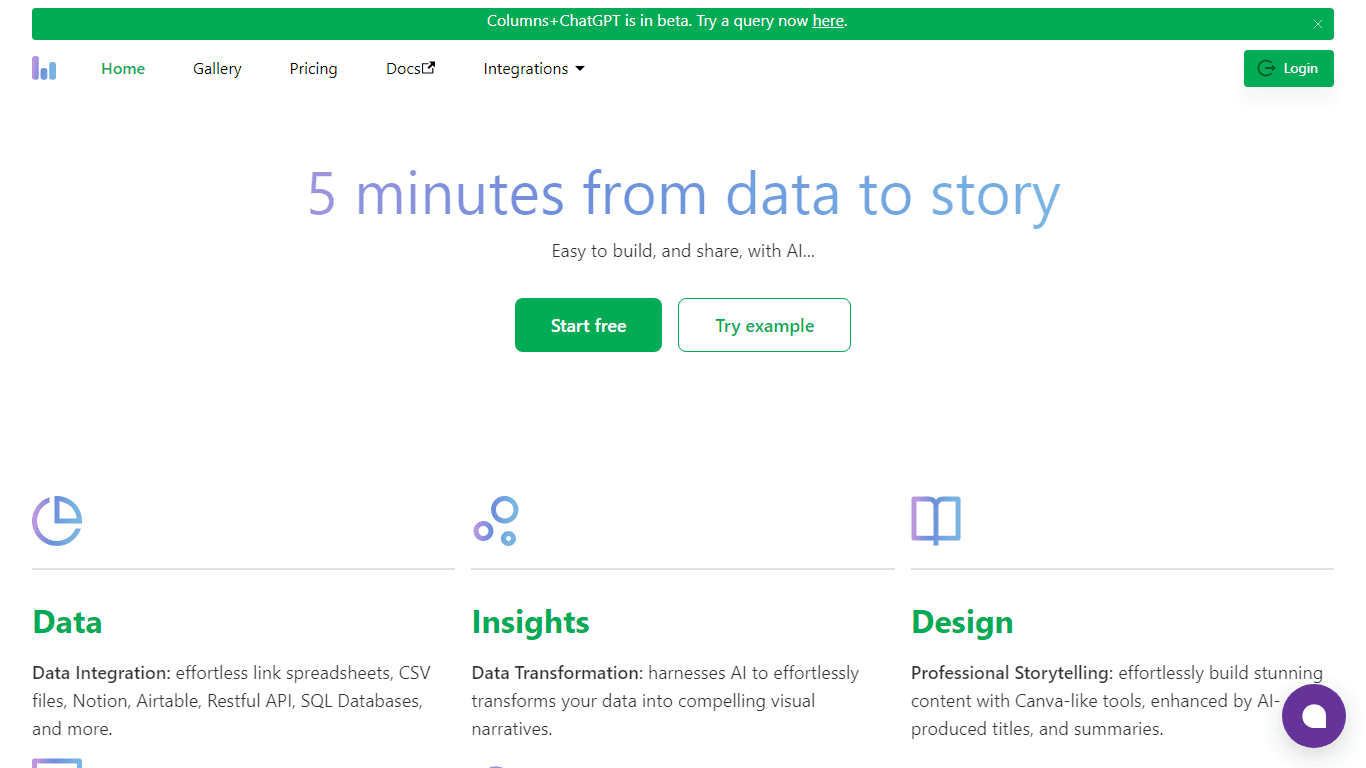
Columns is a fast and intuitive data visualization platform that helps teams turn raw data into clear, engaging stories. It supports a wide range of data sources including Google Sheets, Notion, Airtable, SQL databases, Excel, CSV files, and HTTP APIs, allowing users to connect once and reuse data easily. The platform uses AI to transform data into visual narratives, providing tools to build professional presentations with features similar to Canva, enhanced by AI-generated titles and summaries. Users can share their insights through links, embedded views, exports, or dynamic dashboards, with options for access control and domain whitelisting to protect sensitive information. Columns also automates data updates with scheduling features, ensuring visualizations stay current without manual effort. Its API capabilities allow replicating graph templates with new data and creating shareable URLs for quick collaboration. The platform targets business analysts, marketers, executives, consultants, bloggers, and business owners who need to communicate data insights effectively and make informed decisions. Columns emphasizes simplicity and efficiency, aiming to replace complex tools like Tableau with a more accessible AI-driven solution. It supports interactive AI chat for natural language queries, enabling users to explore data and generate visualizations without technical expertise. Overall, Columns combines data integration, AI-powered analysis, design, sharing, and automation into a single workflow to streamline data storytelling.
Key Features
- 🔗 Connect multiple data sources once and reuse anytime for easy data management
- 🤖 AI Chat lets you ask questions in plain language and get instant visual answers
- 🎨 Build professional stories with Canva-like design tools and AI-generated summaries
- 🔄 Schedule automatic updates to keep your data visuals fresh and accurate
- 🔗 Share interactive graphs via links, embeds, or exports with secure access controls
Pros
- Supports wide range of data sources with reusable live connections
- AI-powered chat enables easy data exploration without coding
- Professional design tools simplify creating engaging stories
- Automated data syncing keeps visuals up to date effortlessly
- Flexible sharing options with strong access control features
Cons
- No free tier with API call access included
- Some advanced features require higher-tier plans
FAQ
How does Columns handle data integration from various sources?
Columns connects to many data sources like Google Sheets, Notion, Airtable, SQL databases, Excel, CSV files, and HTTP APIs, allowing you to connect once and reuse data easily.
Can I automate updates to my data visualizations?
Yes, Columns lets you schedule automatic updates so your visual stories always reflect the latest data without manual effort.
What AI features does Columns offer for data analysis?
Columns includes an AI chat that understands natural language questions and provides visual answers, helping you explore insights without technical skills.
How can I share my data stories with others securely?
You can share via unique links, embed graphs on websites, export images or CSVs, and control access with domain whitelisting to keep your data secure.
Is it possible to customize the design of my data presentations?
Yes, Columns offers Canva-like design tools with AI-generated titles and summaries to help you create professional and engaging presentations.
Who is Columns best suited for?
Columns is ideal for business analysts, marketers, executives, consultants, bloggers, and business owners who need to communicate data insights clearly and efficiently.
You may also like
More tools in Data & Analytics

Supametas.AI
A tool to transform unstructured data into structured formats for AI models and knowledge bases.
ZEN AI
Discover unparalleled customer service with ZEN AI, an intelligent customer support assistant designed for businesses of all sizes. ZEN AI operates around the clock, ensuring that your customers alway
InstaSpeak
InstaSpeak is an innovative AI-powered Learning Management System designed specifically for enhancing spoken English skills. It provides a unique platform that integrates effortlessly with your Englis

AICosts.ai
A tool to centralize tracking and optimization of spending across multiple AI services.

Tagshop AI
A tool to generate video ads from prompts and assets.
Align AI
Streamlines AI strategy alignment with business objectives.

The North
North is an intuitive platform designed to simplify the management of Objectives and Key Results (OKRs), Strategy, and Initiatives for businesses of all sizes. It is a tool that directs teams to trans

Help Docs Generator
A tool to generate customer support help docs from SaaS product screenshots.
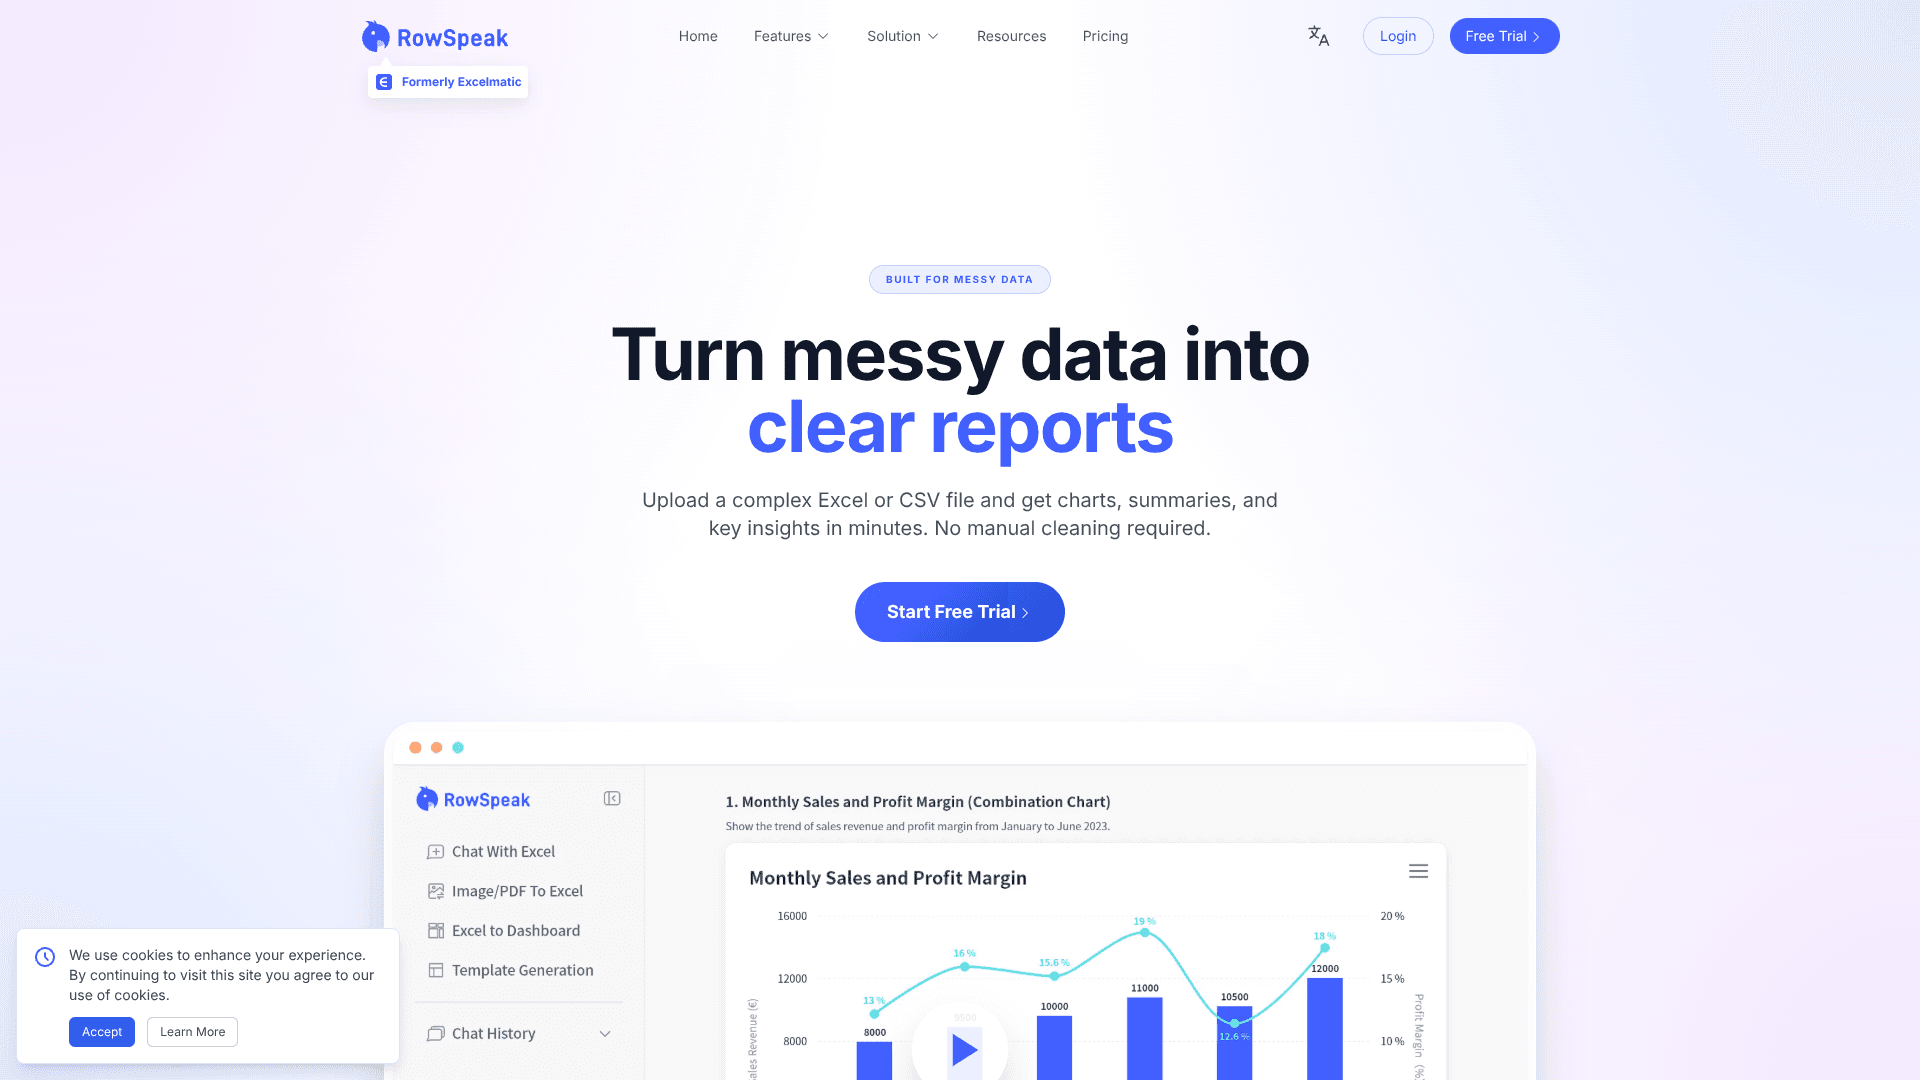
RowSpeak
Turn messy spreadsheets into clear, ready reports.

Prose Fusion
A tool to assist writers with organization, editing, and prompts.

Qoder
Enhance coding efficiency with AI-driven insights.

xAutoDM
xAutoDM is an advanced automation platform designed specifically for managing Twitter direct messages (DMs) through the use of artificial intelligence. The core functionality of xAutoDM revolves aroun