
InstaCharts
InstaCharts is a powerful online tool designed for data visualization, allowing users to create charts, graphs, and tables from their data effortlessly. Its core functionality revolves around transfor
11,075
Votes
20,636
Views
5,103
Bookmarks
About
InstaCharts is a powerful online tool designed for data visualization, allowing users to create charts, graphs, and tables from their data effortlessly. Its core functionality revolves around transforming complex spreadsheet data into visually appealing and easy-to-understand charts without requiring any coding skills. This makes it an ideal solution for a wide range of users, including data analysts, marketers, and researchers who need to present data in a compelling way. The platform supports various data sources, such as Google Sheets, Excel files, and CSV files, enabling users to harness the power of rich data sources for their visualizations. The unique value proposition of InstaCharts lies in its ability to simplify the data visualization process. Users can quickly upload their data and generate charts in minutes, making it a time-saving tool for those who need to analyze and present data efficiently. The intuitive chart designer allows users to customize their charts easily, changing attributes without navigating through complex menus. This user-friendly approach ensures that even those with minimal technical skills can create professional-quality visualizations. InstaCharts differentiates itself from other chart-making tools through its smart data detection feature, which automatically recognizes column types and formats from uploaded spreadsheets. This functionality saves users valuable time by eliminating the need for manual adjustments. Additionally, the platform offers interactive charts that allow viewers to hover over data points for more detailed insights, enhancing the overall user experience. The technical implementation of InstaCharts includes support for various file types, such as CSV, Excel, TSV, and JSON, ensuring compatibility with a wide range of data sources. Users can also export their charts in multiple formats, including PNG and SVG, for easy embedding in reports and presentations. Furthermore, the integration with Zapier allows for automated chart creation, streamlining the workflow for users who require frequent updates to their visualizations. In summary, InstaCharts is a versatile and user-friendly tool that empowers users to create stunning data visualizations quickly and efficiently. With its focus on simplicity, smart features, and compatibility with various data sources, it stands out as a valuable resource for anyone looking to enhance their data presentation skills.
Key Features
- Instant Chart Creation: Users can upload their data and instantly generate charts, saving time and effort in the data visualization process.
- Intuitive Customization: The chart designer allows users to easily customize their charts, including changing chart types, colors, and titles without complex navigation.
- Smart Data Detection: InstaCharts automatically detects column types and formats, making it easier for users to create accurate visualizations without manual adjustments.
- Interactive Data Insights: Users can create interactive charts that allow viewers to hover over data points for detailed information, enhancing understanding of the data.
- Easy Sharing and Embedding: Charts can be shared via public links or embedded into websites, making it simple to present findings to others.
FAQ
What is InstaCharts?
InstaCharts is an online chart generator that automatically creates charts from spreadsheet files. You can share charts and data tables with others through public links.
Which chart types are available?
There are 13 chart types available, including line charts, bar charts, pie charts, and more. You can also create a filterable and sortable data table.
Is it free?
Yes, InstaCharts has a generous free tier where you can try out all features, but it is limited to 500 rows of data and all charts will have a watermark.
What happens to my data if I cancel?
Your data will still be accessible, but only within the free tier limits.
What kinds of data are supported?
InstaCharts can autodetect various data types, including currencies and numbers. It supports many spreadsheet file types like CSV, Excel, and JSON.
Can I send a chart/data table to another person?
Yes! You can turn on the public link for a chart and customize what is shared, including the chart and data table.
You may also like
More tools in Productivity

Supametas.AI
A tool to transform unstructured data into structured formats for AI models and knowledge bases.

ZEN AI
Discover unparalleled customer service with ZEN AI, an intelligent customer support assistant designed for businesses of all sizes. ZEN AI operates around the clock, ensuring that your customers alway

Enjo.ai
A tool that handles support requests by integrating with workplace tools and knowledge bases for context-aware responses.
X-doc
X-doc is a cutting-edge AI-driven platform specializing in large-scale technical document translation. Its core functionality revolves around providing instant translations across 108 languages, ensur
MokSa.AI
Enhances retail operations with AI-driven video intelligence.

Assert AI
Automatically generates test cases, identifies bugs, and provides insights.
HSA Eligible
The Complete Directory of HSA Eligible Items for Easy Expense Tracking serves as a comprehensive resource for individuals looking to manage their Health Savings Account (HSA) expenses effectively. Thi
Zendesk AI
Explore the transformative power of AI-driven customer support with Zendesk AI. With a suite of intelligent tools, including sophisticated bots, enhanced self-service options, and a wealth of producti
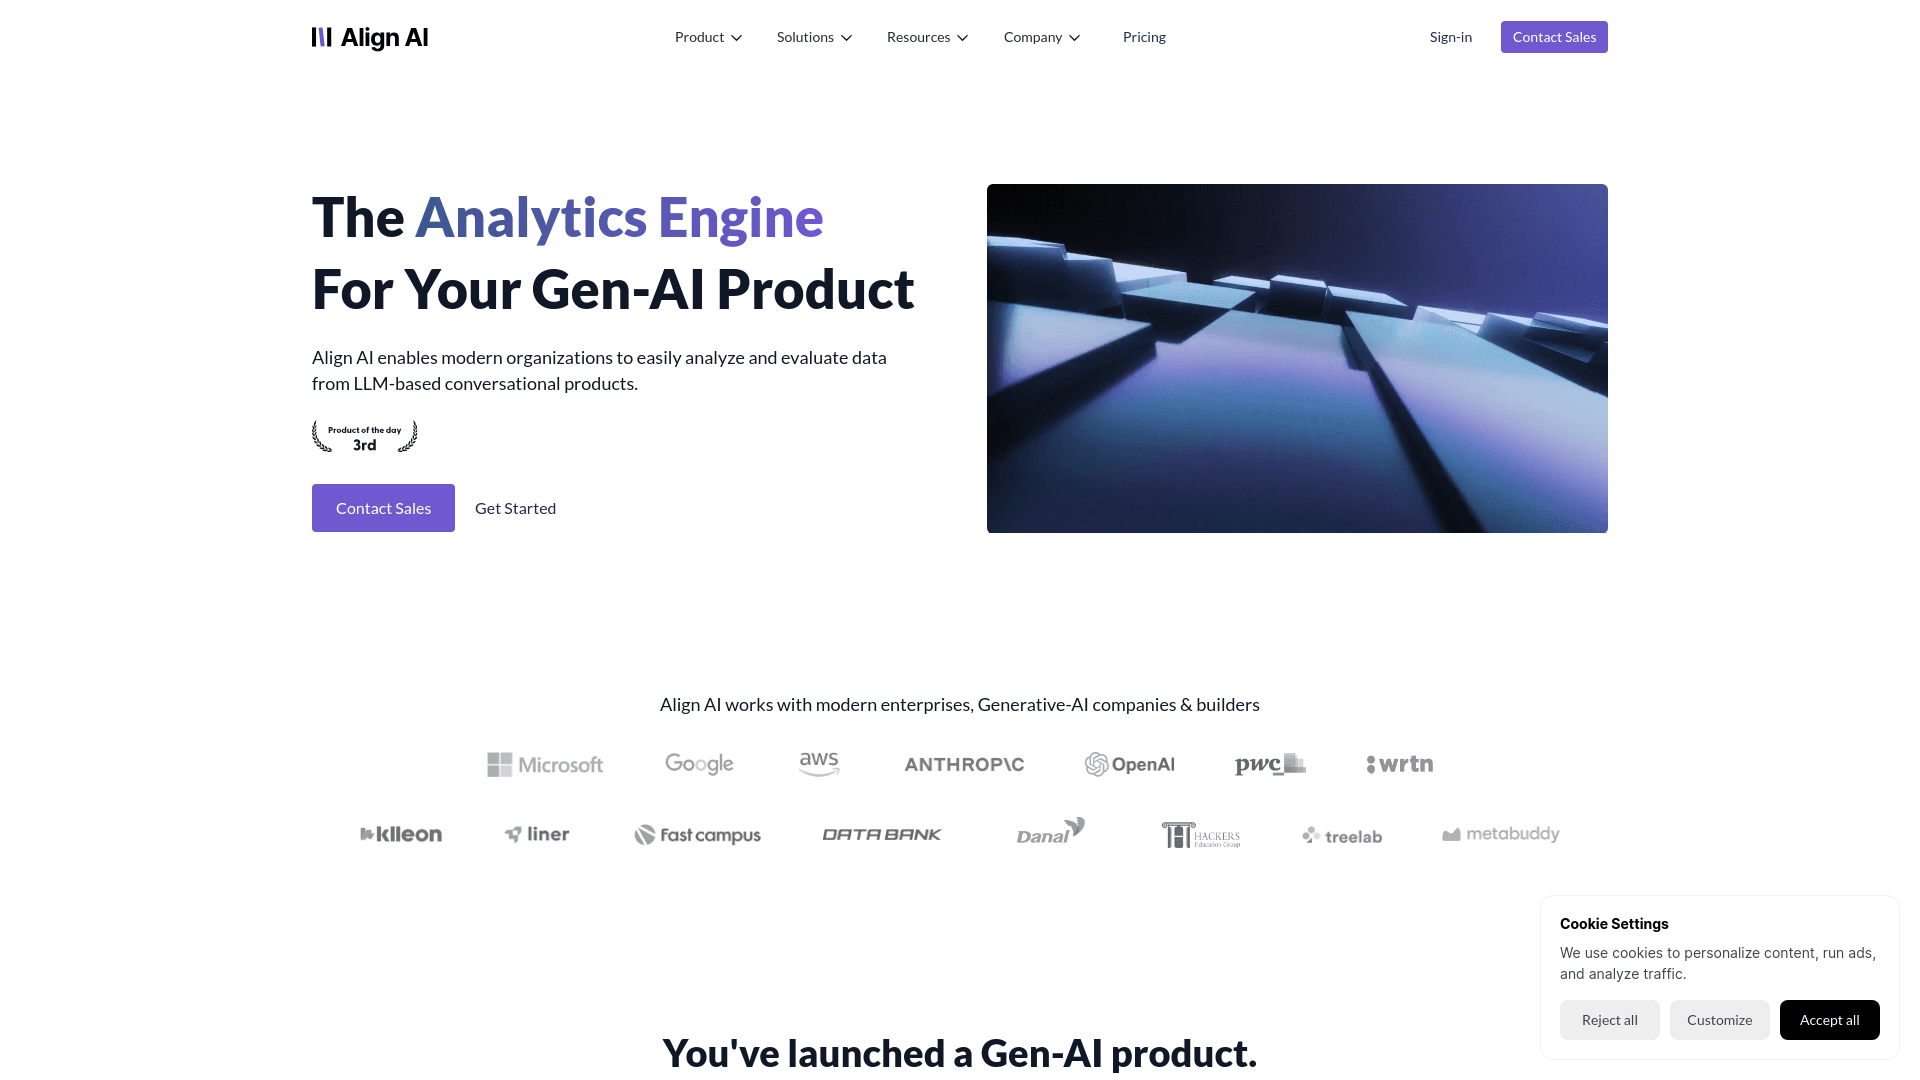
Align AI
Streamlines AI strategy alignment with business objectives.
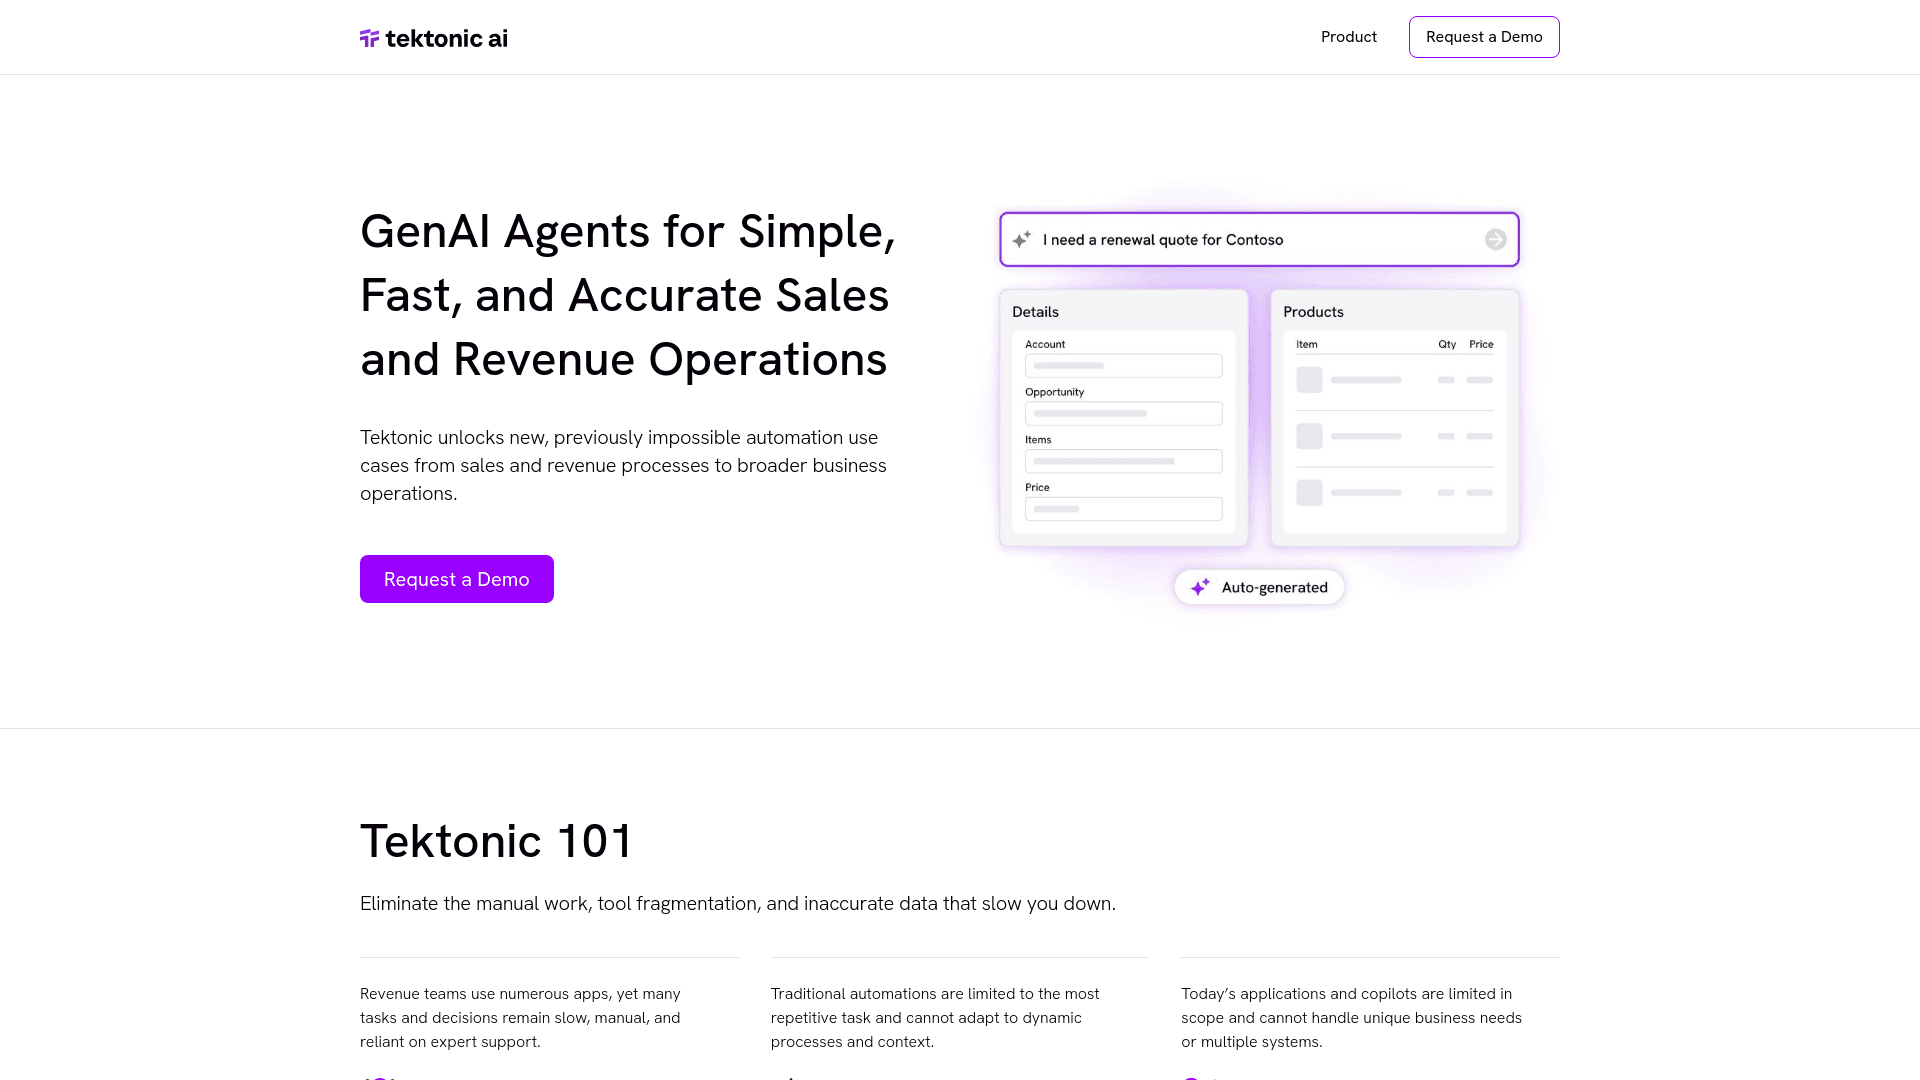
Tektonic AI
Streamline sales and revenue operations with advanced AI-driven automation.
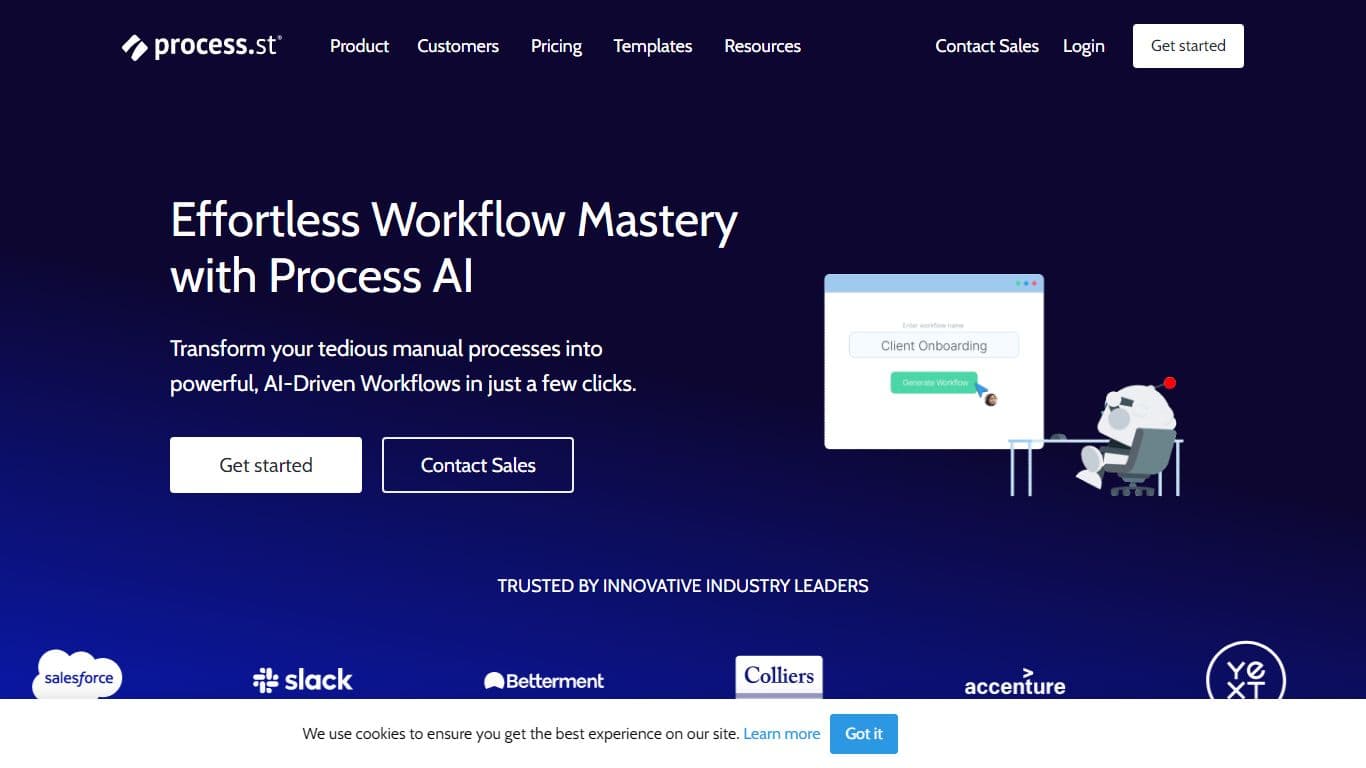
Process AI
Process Street’s AI-powered process platform serves as a single source for teams to manage all recurring work, including workflows, knowledge, data, forms, and surveys. Additionally, customers can gen
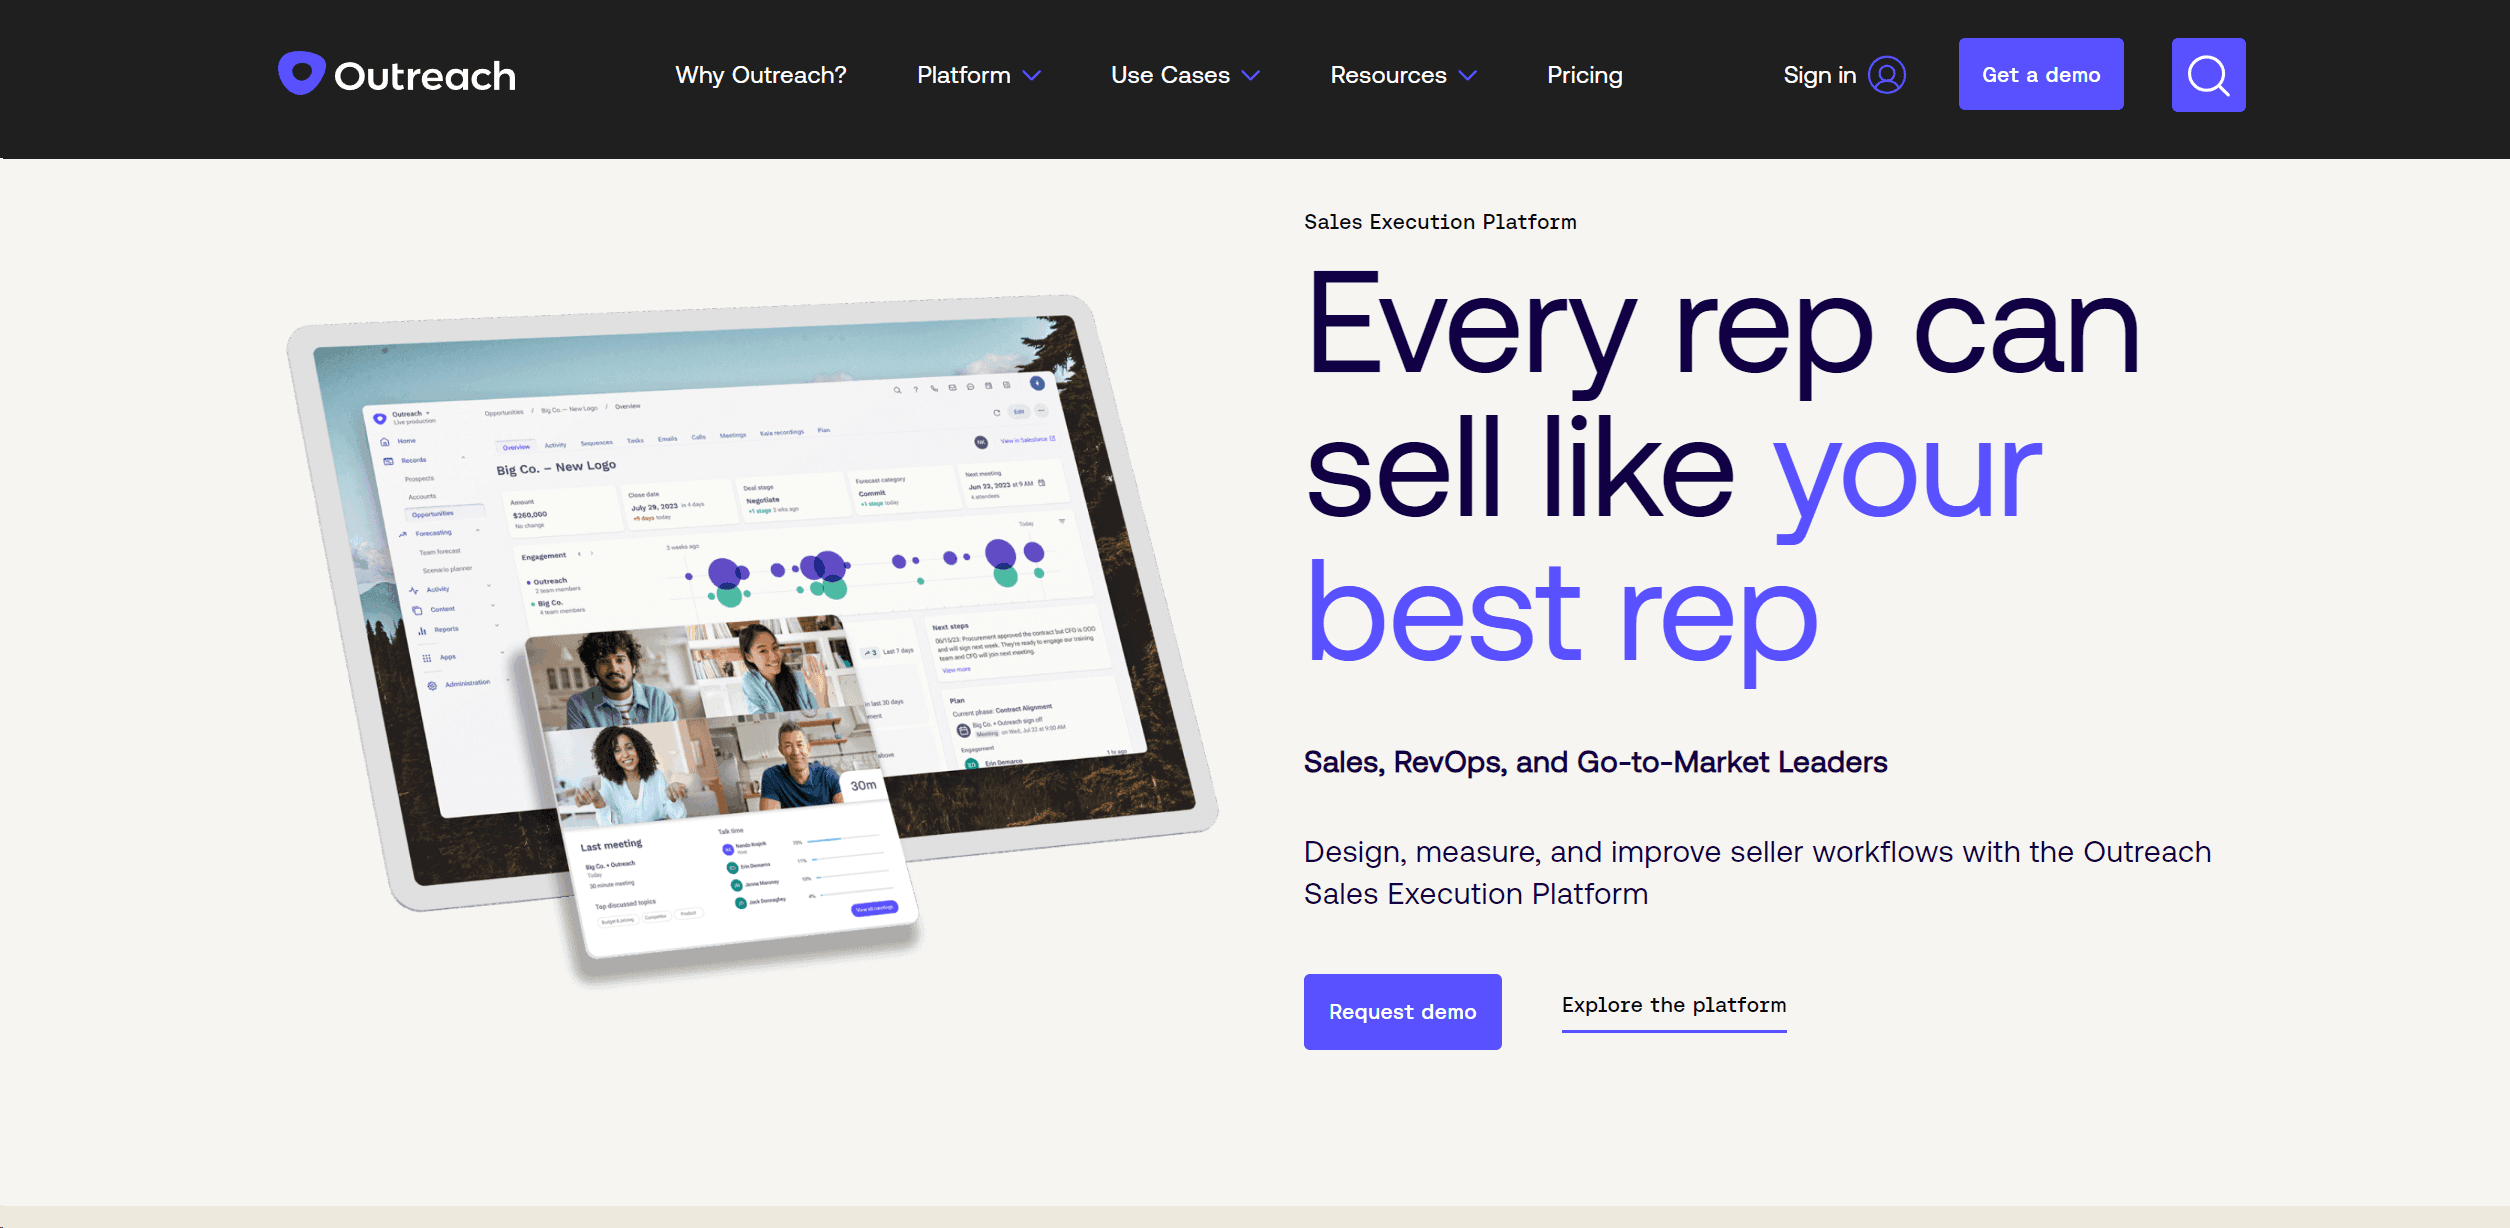
Outreach
Optimize sales, enhance workflows, boost efficiency with AI-powered tools.